A simple and lightweight framework for creating beautiful, interactive vector maps.
Table of Contents
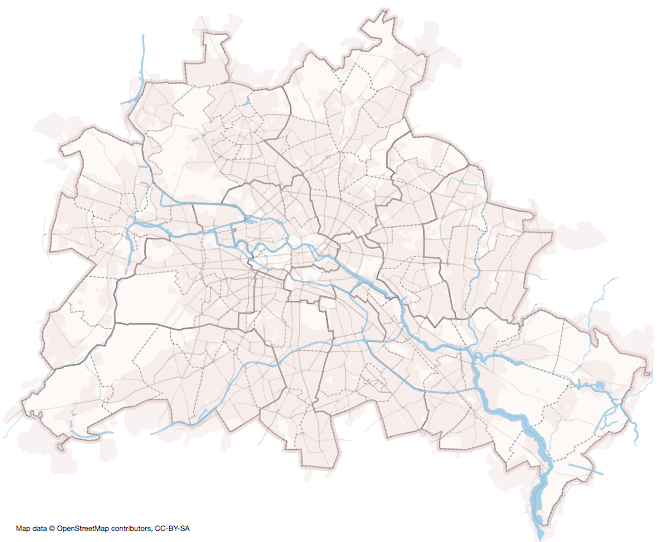
Rendering SVG maps from OpenStreetMap data
This step-by-step tutorial explains how to render nice SVG maps from OpenStreetMap (OSM) data using PostGIS, osm2pgsql and Kartograph.py.
Source: #3082969
Setting up the PostGIS database
After installing PostgreSQL and the PostGIS extension, you need to create a new database for the OSM data.
> createdb osm
Activate PostGIS on that database. You need to know where you installed PostGIS to find the postgis.sql and spatial_ref_sys.sql. For instance, if you installed PostGIS on Mac OS using homebrew, you find them under /usr/local/Cellar/postgis/1.5.3/share/postgis/.
> psql -d osm -f path/to/your/postgis.sql
> psql -d osm -f path/to/your/spatial_ref_sys.sql
Import OpenStreetMap data
Download a fresh OpenStreetMap dump. You can use either the XML version (.osm) or the binary version (.osm.pbf).
> wget http://download.geofabrik.de/osm/europe/germany/berlin.osm.pbf
Install osm2pgsql and import the OSM dump into the database. This can take quite a while (and consume lots of RAM), depending on the actual size of the dump.
> osm2pgsql -l -r pbf -d osm berlin.osm.pbf
Render the SVG map
And that's it. Now you can create a map using the latest bleeding edge version of Kartograph and the following minimal map configuration:
{
    "roads": {
        "src": "postgis:dbname=osm",
        "table": "planet_osm_roads"
    }
}
Store this as map.json and run kartograph map.json -o map.svg to get a map like this:
