A simple and lightweight framework for creating beautiful, interactive vector maps.
Table of Contents
Symbol Maps
You can add symbols to a map using the map.addSymbols function. You need to provide a config dictionary filled with at least the following properties:
type— defines which kind of symbols you want to usedata— an array of data objects of which each will be represented by a symbollocation— a function which returns an array [longitude, latitude]
The following example adds exactly one label to the map:
map.addSymbols({
    type: $K.Label,
    data: [{ name: 'Berlin', lon: 13.4, lat: 52.517 }],
    location: function(d) { return [d.lon, d.lat] },
    text: function(d) { return d.name; }
});
Symbol Types
Labels
To label a layer in your map you can use . If location() returns a string in the format "LAYER_ID.PATH_ID", Kartograph will try to calculate a nice position in the center of that layer path.
map.addSymbols({
    type: kartograph.Label,
    data: map.getLayer('countries').getPathsData(),
    location: function(d) { return 'countries.' + d.id; },
    text: function(d) { return d.name; }
});
Circles/Bubbles
See this example
map.addSymbols({
    type: kartograph.Bubble,
    data: map.getLayer('countries').getPathsData(),
    location: function(d) { return 'countries.' + d.id; },
    radius: function(d) { return 20; },
    style: 'fill:red',
    title: function(d) { return d.name; }
});
Labeled Bubbles
...
Images
You can use the symbol API to add image marker to your map.
Sorting Symbols
Sometimes it's useful to control the order in which symbols are drawn to the map. A typical example are sized circles that are more usable when drawn from largest to smallest.
map.addSymbols({
    type: kartograph.Bubble,
    sortBy: 'radius desc',
    radius: function(d) { return Math.sqrt(d.value); }
});
You can sort by symbol data by passing a function that returns a numerical value or string:
map.addSymbols({
    type: kartograph.Bubble,
    sortBy: function(d) { return d.someVar; },
});
Updating Symbols
Updating the symbols can be done by calling the update() method of a SymbolGroup. Note that you cannot change the symbol type afterwards.
var symbols = map.addSymbols(...);
symbols.update({
    radius: 30
});
You can also get a reference to the symbol group later using map.symbolGroups.
Animated updates
Currently there's a quick-fix for animated symbol updates.
symbols.update({
    radius: 30
}, true);
You can define the animation in more detail. See RaphaelJS documentation on Element.animate() for more information on the parameters.
symbols.update({
    radius: 30
}, 500, 'ease-out');
Removing Symbols
To remove a group of symbols from your map, simply call map.removeSymbols(). If you added multiple symbol layers, you can pass and index to specify the one to remove. Otherwise, all symbols will be removed.
// remove the second symbol group
map.removeSymbols(1);
// remove all symbol groups
map.removeSymbols();
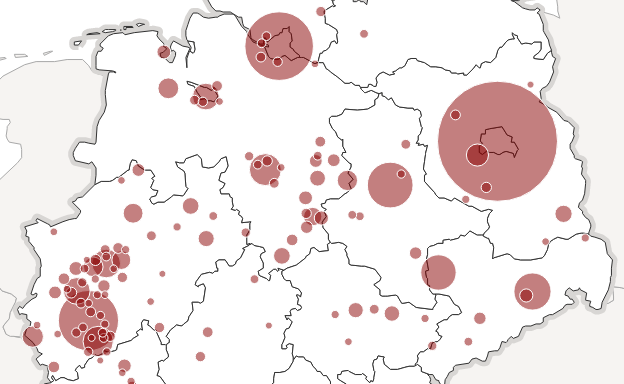
Clustering Map Symbols
In some cases where you have too many symbols to show, it makes sense to cluster symbols in order to preserve the overall readability of the map. To activate clustering you need to add two things to the symbol config: the name of clustering technique (either k-means or noverlap) and a function that aggregates data objects of the grouped symbols. See this map for demonstration.
function sumVisits(cities) {
    var total = 0;
    $.each(cities, function(i, city) {
        total += city.visits;
    });
    return { visits: total };
}

map.addSymbols({
    type: kartograph.Bubble,
    data: cities,
    location: function(city) { return [city.lon, city.lat]; },
    radius: function(d) { return Math.sqrt(city.nb_visits); },
    // name of clustering technique
    clustering: 'noverlap',
    // aggregation function
    aggregate: sumVisits
});
Fine-tuning k-Means
The k-Means clustering allows you to control the final number of clusters. The default is set to 64.
map.addSymbols({
    // ...
    clustering: 'k-means',
    clusteringOpts: {
        size: 16
    },
    aggregate: sumVisits
});
Fine-tuning noverlap
In noverlap clustering you can control the tolerance to which overlapping is accepted (0.1 means we tolerate 10% overlapping of adjacent symbols). The parameter maxRatio let's you prevent overlapping of equally sized symbols. A value of 0.8 means that no symbols are grouped it the radius of the smaller symbol is larger than 80% of the radius of the larger symbol.
map.addSymbols({
    // ...
    clustering: 'noverlap',
    clusteringOpts: {
        tolerance: 0.1,
        maxRatio: 0.8
    },
    aggregate: sumVisits
});
Dorling cartograms
See Dorling cartogram tutorial for more information.
symbols = map.addSymbols({
    // ...
    type: kartograph.Bubble
});
kartograph.dorlingLayout(symbols);